- What is the problem statement?
- How did you solve the problem?
- What tools did you use?
- What did you do?
- What is the impact?
Data source: Kaggle
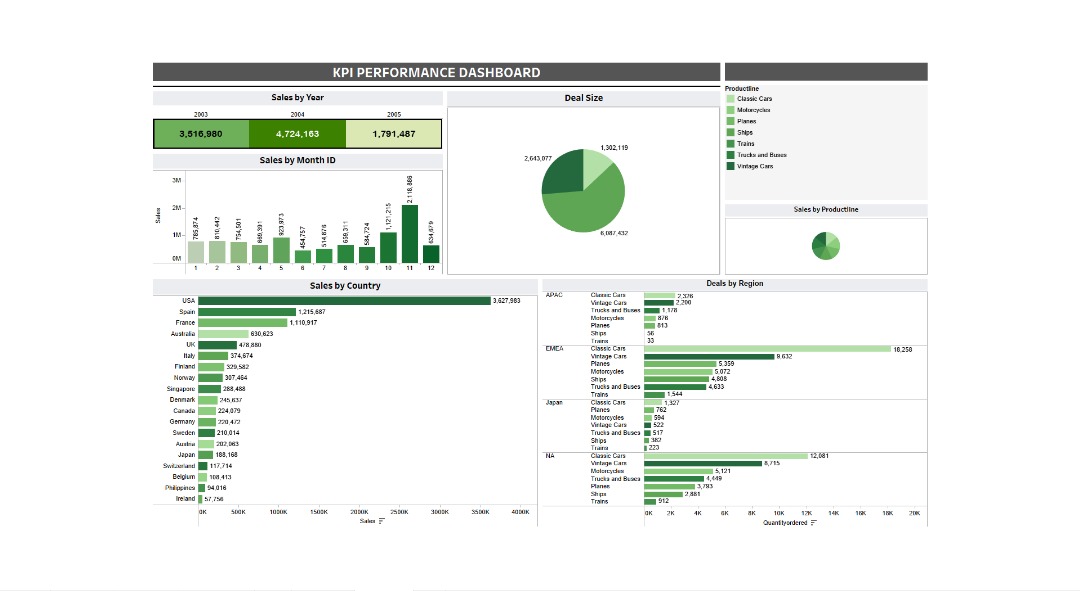
Sales Distribution of Product Line
Product Line: Vintage Cars, Trucks And Buses, Trains, Ships, Plans, Motorcycles and Classic Cars
Tools: Excel and Tableau
Task (problem)
Inspired for retail analytics. I found the set could be useful for Sales Simulation and Used for Segmentation, Customer Analytics, Clustering and More.
Built interactive dashboard on Tableau on sales and product performance over time.
Vizualise technical insights on what product performance by region.