
This portfolio project was an opportunity to analyze a dataset that can provide insights to the restaurant management service in NYC.
The aim of the project was to answer the following questions through exploratory data analysis.
What is the minimum, average, and maximum time it takes for food to be prepared once an order is placed?
How many orders are not rated? Is this data clean? Why or why not?
What are the most popular cuisine types?
How does their price range and review rating compare to those that don't perforT as well?
try to find out why they perform better.
Are they ordering more on weekdays or weekends?
Is preparation time longer on weekdays or weekends?
What is the delivery time on weekdays vs weekends?
Which are the top restaurants with orders received?
What is the most popular cuisine type on weekends?
what percentage of orders are less than $20? less than $30? $40? $50? what is the average delivery time in NYC?
The company has decided to give 20% discount vouchers to the top 3 most frequent customers. Find the IDs of these customers and the number of orders hey placed cost of cuisine typ comparison ratings based on cuisine type preparation time based o cuisine type.
The company want p to provide a promotional offer in the advertisement of the restaurants. The condition to get the offer is that the restaurants must have a rating count of more than 50 and the average rating should be greater than 4.
Find the restaurants fulfilling the criteria to get the promotional offer. The company charges the restaurant 25% on the orders having cost greater than 20 dollars and 15% on the orders having cost greater than 5 dollars. Find the net revenue generated by the company across all orders.
The company wants to analyze the total time required to deliver the food. What percentage of orders take more than 60 minutes to get delivered from the time the order is placed? (The food has to be prepared and then delivered.)
The company wants to analyze the delivery time of the orders on weekdays and weekends. How does the mean delivery time vary during week days and weekends?
What are your conclusions from the analysis? What recommendations would you like to share to help improve the business? ove the business?
I used the process of Exploratory Data Analysis EDA to answer the above questions
import numpy as np
import pandas as pd
import matplotlib.pyplot as plt
import seaborn as sns
import plotly.express as px
from sklearn.preprocessing import LabelEncoder
df=pd.read_csv ('foodhub.csv')
df.head()
| order_id | customer_id | restaurant_name | cuisine_type | cost_of_the_order | day_of_the_week | rating | food_preparation_time | delivery_time | |
|---|---|---|---|---|---|---|---|---|---|
| 0 | 1477147 | 337525 | Hangawi | Korean | 30.75 | Weekend | Not given | 25 | 20 |
| 1 | 1477685 | 358141 | Blue Ribbon Sushi Izakaya | Japanese | 12.08 | Weekend | Not given | 25 | 23 |
| 2 | 1477070 | 66393 | Cafe Habana | Mexican | 12.23 | Weekday | 5 | 23 | 28 |
| 3 | 1477334 | 106968 | Blue Ribbon Fried Chicken | American | 29.20 | Weekend | 3 | 25 | 15 |
| 4 | 1478249 | 76942 | Dirty Bird to Go | American | 11.59 | Weekday | 4 | 25 | 24 |
#Is this data clean?

df.shape
(1898, 9)
df.columns
Index(['order_id', 'customer_id', 'restaurant_name', 'cuisine_type',
       'cost_of_the_order', 'day_of_the_week', 'rating',
       'food_preparation_time', 'delivery_time'],
      dtype='object')
1. Is the date clean? why or why not?
df.isnull().sum()
order_id                 0
customer_id              0
restaurant_name          0
cuisine_type             0
cost_of_the_order        0
day_of_the_week          0
rating                   0
food_preparation_time    0
delivery_time            0
dtype: int64
df.duplicated().sum()
0
df.info()
<class 'pandas.core.frame.DataFrame'>
RangeIndex: 1898 entries, 0 to 1897
Data columns (total 9 columns):
 #   Column                 Non-Null Count  Dtype
---  ------                 --------------  -----
 0   order_id               1898 non-null   int64
 1   customer_id            1898 non-null   int64
 2   restaurant_name        1898 non-null   object
 3   cuisine_type           1898 non-null   object
 4   cost_of_the_order      1898 non-null   float64
 5   day_of_the_week        1898 non-null   object
 6   rating                 1898 non-null   object
 7   food_preparation_time  1898 non-null   int64
 8   delivery_time          1898 non-null   int64
dtypes: float64(1), int64(4), object(4)
memory usage: 133.6+ KB
Data is cleaned, no null values, no duplicate values
2. What is the minimum, average, and maximum time it takes for food to be prepared once an order is placed?
df.describe()
| order_id | customer_id | cost_of_the_order | food_preparation_time | delivery_time | |
|---|---|---|---|---|---|
| count | 1.898000e+03 | 1898.000000 | 1898.000000 | 1898.000000 | 1898.000000 |
| mean | 1.477496e+06 | 171168.478398 | 16.498851 | 27.371970 | 24.161749 |
| std | 5.480497e+02 | 113698.139743 | 7.483812 | 4.632481 | 4.972637 |
| min | 1.476547e+06 | 1311.000000 | 4.470000 | 20.000000 | 15.000000 |
| 25% | 1.477021e+06 | 77787.750000 | 12.080000 | 23.000000 | 20.000000 |
| 50% | 1.477496e+06 | 128600.000000 | 14.140000 | 27.000000 | 25.000000 |
| 75% | 1.477970e+06 | 270525.000000 | 22.297500 | 31.000000 | 28.000000 |
| max | 1.478444e+06 | 405334.000000 | 35.410000 | 35.000000 | 33.000000 |
The Minimum time for 20 minutes, the maximum time is 35 minutes and the average time is 27.37 minutes
3. How many orders are not rated?
count_rate = df['rating'].value_counts()
count_rate
rating
Not given    736
5            588
4            386
3            188
Name: count, dtype: int64
There are no reviews for 736 orders
4. What are the most popular cuisine types?
How does their price range and review rating compare to those that don't perform as well? try to find out why they perform better.
count_cusine = df['cuisine_type'].value_counts()
count_cusine
cuisine_type
American          584
Japanese          470
Italian           298
Chinese           215
Mexican            77
Indian             73
Middle Eastern     49
Mediterranean      46
Thai               19
French             18
Southern           17
Korean             13
Spanish            12
Vietnamese          7
Name: count, dtype: int64
The 4 most popular cuisine_type are; American (584) Japanese (470) Italian (298) Chinese (215)
def calculate_average_cost_by_cuisine(df):
    # Grouping by 'cuisine_type' and calculate the mean of average 'cost_of_the_order'
    average_costs = df.groupby('cuisine_type')['cost_of_the_order'].mean()
    return average_costs
average_costs = calculate_average_cost_by_cuisine(df)
print(average_costs)
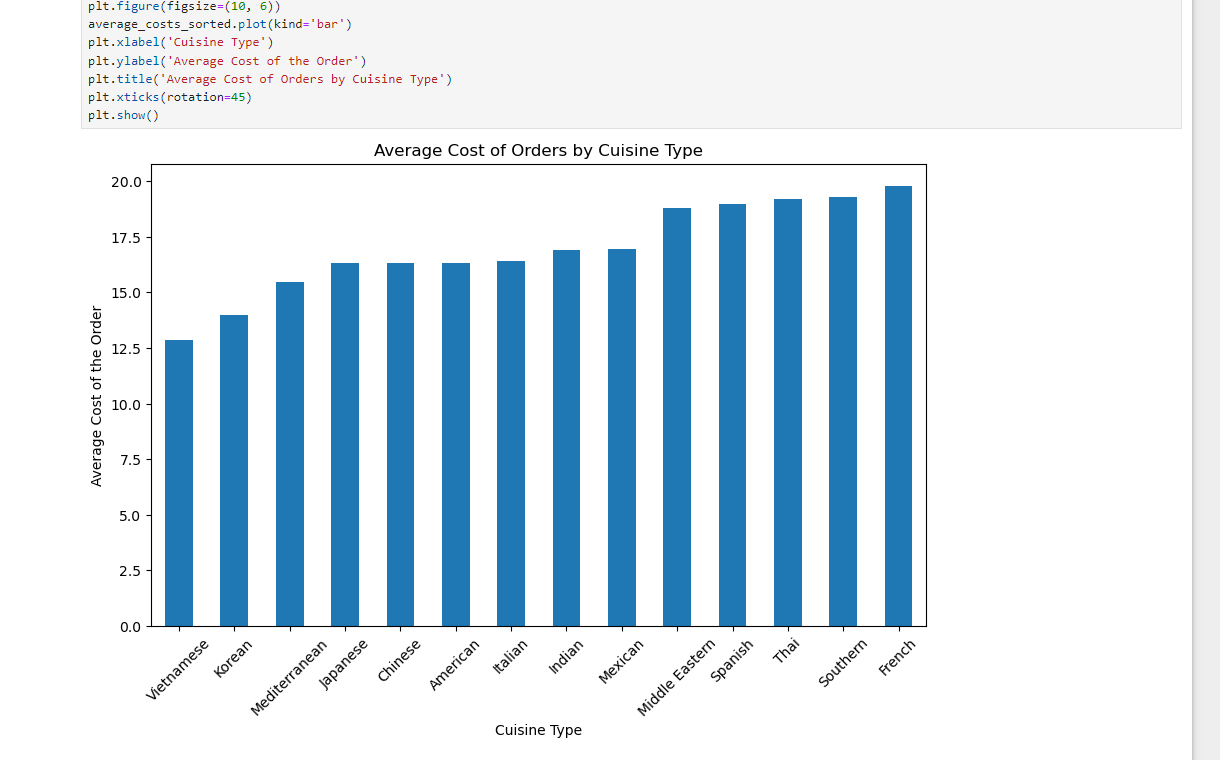
cuisine_type
American          16.319829
Chinese           16.305209
French            19.793889
Indian            16.919726
Italian           16.418691
Japanese          16.304532
Korean            14.001538
Mediterranean     15.474783
Mexican           16.933117
Middle Eastern    18.820612
Southern          19.300588
Spanish           18.994167
Thai              19.207895
Vietnamese        12.882857
Name: cost_of_the_order, dtype: float64
average_costs_sorted = average_costs.sort_values(ascending=True)
plt.figure(figsize=(10, 6))
average_costs_sorted.plot(kind='bar')
plt.xlabel('Cuisine Type')
plt.ylabel('Average Cost of the Order')
plt.title('Average Cost of Orders by Cuisine Type')
plt.xticks(rotation=45)
plt.show()

def calculate_average_rating_by_cuisine(df):
    # Grouping by 'cuisine_type' and calculate the mean of average rating
     # Replace "Not given" with NaN
    df['rating'] = pd.to_numeric(df['rating'], errors='coerce')
    average_rating = df.groupby('cuisine_type')['rating'].mean()
    return average_rating
average_rating = calculate_average_rating_by_cuisine(df)
print(average_rating)
cuisine_type
American          4.298913
Chinese           4.338346
French            4.300000
Indian            4.540000
Italian           4.360465
Japanese          4.373626
Korean            4.111111
Mediterranean     4.218750
Mexican           4.416667
Middle Eastern    4.235294
Southern          4.307692
Spanish           4.833333
Thai              4.666667
Vietnamese        4.000000
Name: rating, dtype: float64
std_dev_mean_ratings = average_rating.std()
print(std_dev_mean_ratings)
0.21328238900474772
dataframe=df.loc[:,['restaurant_name','cuisine_type','cost_of_the_order','day_of_the_week','rating','food_preparation_time', 'delivery_time']]
dataframe.head()
| restaurant_name | cuisine_type | cost_of_the_order | day_of_the_week | rating | food_preparation_time | delivery_time | |
|---|---|---|---|---|---|---|---|
| 0 | Hangawi | Korean | 30.75 | Weekend | NaN | 25 | 20 |
| 1 | Blue Ribbon Sushi Izakaya | Japanese | 12.08 | Weekend | NaN | 25 | 23 |
| 2 | Cafe Habana | Mexican | 12.23 | Weekday | 5.0 | 23 | 28 |
| 3 | Blue Ribbon Fried Chicken | American | 29.20 | Weekend | 3.0 | 25 | 15 |
| 4 | Dirty Bird to Go | American | 11.59 | Weekday | 4.0 | 25 | 24 |
What is the correlationship that exists within the dataset?
# Label encode categorical columns
label_encoder = LabelEncoder()

# List of categorical columns to encode
categorical_columns = ['restaurant_name', 'cuisine_type', 'day_of_the_week']

for column in categorical_columns:
    dataframe[column] = label_encoder.fit_transform(dataframe[column])
dataframe.head()
| restaurant_name | cuisine_type | cost_of_the_order | day_of_the_week | rating | food_preparation_time | delivery_time | |
|---|---|---|---|---|---|---|---|
| 0 | 67 | 6 | 30.75 | 1 | NaN | 25 | 20 |
| 1 | 23 | 5 | 12.08 | 1 | NaN | 25 | 23 |
| 2 | 29 | 8 | 12.23 | 0 | 5.0 | 23 | 28 |
| 3 | 20 | 0 | 29.20 | 1 | 3.0 | 25 | 15 |
| 4 | 47 | 0 | 11.59 | 0 | 4.0 | 25 | 24 |
dataframe.corr()
| restaurant_name | cuisine_type | cost_of_the_order | day_of_the_week | rating | food_preparation_time | delivery_time | |
|---|---|---|---|---|---|---|---|
| restaurant_name | 1.000000 | -0.110332 | -0.012247 | -0.001656 | 0.031119 | 0.007109 | 0.026797 |
| cuisine_type | -0.110332 | 1.000000 | 0.035184 | -0.012140 | 0.028304 | -0.028737 | -0.005913 |
| cost_of_the_order | -0.012247 | 0.035184 | 1.000000 | 0.015960 | 0.033983 | 0.041527 | -0.029949 |
| day_of_the_week | -0.001656 | -0.012140 | 0.015960 | 1.000000 | 0.030727 | 0.021970 | -0.534801 |
| rating | 0.031119 | 0.028304 | 0.033983 | 0.030727 | 1.000000 | -0.006083 | -0.009804 |
| food_preparation_time | 0.007109 | -0.028737 | 0.041527 | 0.021970 | -0.006083 | 1.000000 | 0.011094 |
| delivery_time | 0.026797 | -0.005913 | -0.029949 | -0.534801 | -0.009804 | 0.011094 | 1.000000 |
sns.heatmap(dataframe.corr(),
            annot=True,
           cbar=False)
plt.show()

a. The price range and reviews do no directly explain why some cuisine perform better because the average rating of cuisine is between 4.0 and 4.83 and standard deviation of 0.21 which implies the data points are very close to the mean.
b. In same light, there is no linear relationship within the dataset.
dataframe2=df.loc[:,['restaurant_name','cuisine_type','cost_of_the_order','day_of_the_week','rating','food_preparation_time', 'delivery_time']]
dataframe.head()
| restaurant_name | cuisine_type | cost_of_the_order | day_of_the_week | rating | food_preparation_time | delivery_time | |
|---|---|---|---|---|---|---|---|
| 0 | 67 | 6 | 30.75 | 1 | NaN | 25 | 20 |
| 1 | 23 | 5 | 12.08 | 1 | NaN | 25 | 23 |
| 2 | 29 | 8 | 12.23 | 0 | 5.0 | 23 | 28 |
| 3 | 20 | 0 | 29.20 | 1 | 3.0 | 25 | 15 |
| 4 | 47 | 0 | 11.59 | 0 | 4.0 | 25 | 24 |
# Group by 'cuisine_type' and 'day_of_the_week' and count the number of orders
order_counts = df.groupby(['cuisine_type', 'day_of_the_week']).size().unstack(fill_value=0)

# Display the result
print(order_counts)
day_of_the_week  Weekday  Weekend
cuisine_type
American             169      415
Chinese               52      163
French                 5       13
Indian                24       49
Italian               91      207
Japanese             135      335
Korean                 2       11
Mediterranean         14       32
Mexican               24       53
Middle Eastern        17       32
Southern               6       11
Spanish                1       11
Thai                   4       15
Vietnamese             3        4
average_times = df.groupby('cuisine_type')[['food_preparation_time', 'delivery_time']].mean()
print(average_times)
                food_preparation_time  delivery_time
cuisine_type
American                    27.440068      24.193493
Chinese                     27.511628      23.855814
French                      26.888889      25.333333
Indian                      27.109589      24.082192
Italian                     27.483221      24.567114
Japanese                    27.510638      24.131915
Korean                      25.461538      20.923077
Mediterranean               27.000000      23.586957
Mexican                     26.727273      24.389610
Middle Eastern              26.673469      24.081633
Southern                    27.588235      23.823529
Spanish                     26.916667      23.416667
Thai                        27.315789      23.157895
Vietnamese                  25.714286      26.142857
# Reset index to use cuisine_type as a column for plotting
average_times = average_times.reset_index()
plt.figure(figsize=(9, 5))
sns.barplot(x='cuisine_type', y='food_preparation_time', data=average_times, palette='viridis')
plt.title('Average Food Preparation Time by Cuisine Type')
plt.xlabel('Cuisine Type')
plt.ylabel('Average Food Preparation Time (minutes)')
plt.xticks(rotation=45)
plt.show()

# Plot the average delivery time
plt.figure(figsize=(9, 5))
sns.barplot(x='cuisine_type', y='delivery_time', data=average_times, palette='viridis')
plt.title('Average Delivery Time by Cuisine Type')
plt.xlabel('Cuisine Type')
plt.ylabel('Average Delivery Time (minutes)')
plt.xticks(rotation=45)
plt.show()

I have tried to look at the discrepancies in the data from total orders by weekday and weekend, and also looking at the average preparation time and selivery time.
However, the cuisine performance could be a preferance of the population charactics; such as background influence.
5. Are they ordering more on weekdays or weekends?
The above analysis shows that more orders come on the weekends looking at the counts
6. Is preparation time longer on weekdays or weekends?
average_times_by_week = df.groupby('day_of_the_week')[['food_preparation_time', 'delivery_time']].mean()
print(average_times_by_week)
                 food_preparation_time  delivery_time
day_of_the_week
Weekday                      27.212066      28.340037
Weekend                      27.436714      22.470022
Preparation time is slightly longer on weekend with an average of 27.44 , fairly explained by the high orders received.
On the orther have delivery time is higher on the weekdays.
7. which are the top restaurants with orders received?
count_restaurants = df['restaurant_name'].value_counts()
freq_above_30 = count_restaurants[count_restaurants > 30]
print(freq_above_30)
restaurant_name
Shake Shack                      219
The Meatball Shop                132
Blue Ribbon Sushi                119
Blue Ribbon Fried Chicken         96
Parm                              68
RedFarm Broadway                  59
RedFarm Hudson                    55
TAO                               49
Han Dynasty                       46
Blue Ribbon Sushi Bar & Grill     44
Nobu Next Door                    42
Rubirosa                          37
Sushi of Gari 46                  37
Name: count, dtype: int64
The top three restaurants are;
Shake Shack (219), The Meatball Shop (132), and Blue Ribbon Sushi (119)
filtered_restaurants = df['restaurant_name'].value_counts()[df['restaurant_name'].value_counts() > 30]
# Sort ratings by their counts in ascending order
sorted_res = filtered_restaurants.index

plt.figure(figsize = (10,8))
sns.countplot(y='restaurant_name', data=df[df['restaurant_name'].isin(filtered_restaurants.index)], order=sorted_res,palette='viridis')
plt.xlabel('Frequency')
plt.ylabel('Restaurant')
plt.show()

The most popular restaurants by orders are Blue Shake Shack 219, The Meatball Shop 132, and Blue Ribbon Sushi 119
8. what is the most popular cuisine type on weekends?
weekend_cuisine_order = df.groupby(['cuisine_type', 'day_of_the_week']).size().unstack(fill_value=0)
print(weekend_cuisine_order)
day_of_the_week  Weekday  Weekend
cuisine_type
American             169      415
Chinese               52      163
French                 5       13
Indian                24       49
Italian               91      207
Japanese             135      335
Korean                 2       11
Mediterranean         14       32
Mexican               24       53
Middle Eastern        17       32
Southern               6       11
Spanish                1       11
Thai                   4       15
Vietnamese             3        4
# Filter DataFrame for
filtered_df = df[df['day_of_the_week'].isin(['Weekend'])]
#order
sorted_cuisines = filtered_df.index

# Plotting with Seaborn
plt.figure(figsize=(12, 6))
sns.countplot(data=filtered_df, x='cuisine_type', hue='day_of_the_week', palette='viridis')
plt.title('Cuisine Type Count for Monday and Tuesday')
plt.xlabel('Cuisine Type')
plt.ylabel('Count')
plt.xticks(rotation=45)
plt.show()

9. what percentage of orders are less than $20? less than $30? $40? $50?
def percentage_below_thresholds(df, thresholds, column_name='cost_of_the_order'):
    total_orders = df.shape[0]
    percentages = {}

    for threshold in thresholds:
        orders_below_threshold = df[df[column_name] < threshold].shape[0]
        percentage_below_threshold = (orders_below_threshold / total_orders) * 100
        percentages[threshold] = percentage_below_threshold

    return percentages

# Define the thresholds
thresholds = [20, 30, 40, 50]

# Get the percentages
percentages = percentage_below_thresholds(df, thresholds)

# Print the results
for threshold, percentage in percentages.items():
    print(f"Percentage of orders less than ${threshold}: {percentage:.2f}%")
Percentage of orders less than $20: 70.76%
Percentage of orders less than $30: 94.73%
Percentage of orders less than $40: 100.00%
Percentage of orders less than $50: 100.00%
- what is the average delivery time in NYC?
df['delivery_time'].mean()
24.161749209694417
IDs of these customers and the number of orders they placed
def top_customers(df, n=3):
    # Group by customer_id and count the number of orders for each customer
    customer_order_counts = df['customer_id'].value_counts()

    # Get the top n customers
    top_n_customers = customer_order_counts.head(n)

    # Convert to DataFrame for better readability
    top_n_customers_df = top_n_customers.reset_index()
    top_n_customers_df.columns = ['customer_id', 'number_of_orders']

    return top_n_customers_df

# Get the top 3 customers
top_3_customers = top_customers(df, 3)

print(top_3_customers)
   customer_id  number_of_orders
0        52832                13
1        47440                10
2        83287                 9
def top_customers_cuisines(df, n=3):
    # Group customer_id and count the number of orders for each customer
    customer_order_counts = df['customer_id'].value_counts()

    # Get top n customers
    top_n_customers = customer_order_counts.head(n).index

    # Filter DFrame to include only orders from the top n customers
    top_customers_orders = df[df['customer_id'].isin(top_n_customers)]

    # Get unique cuisines from these orders
    top_cuisines = top_customers_orders['cuisine_type'].unique()

    return top_cuisines

# Get cuisines for top 3 customers
top_cuisines = top_customers_cuisines(df, 3)

print(top_cuisines)
['American' 'Chinese' 'Middle Eastern' 'Japanese' 'Mexican' 'Korean'
 'Indian' 'Spanish' 'French']
def top_customers_top_cuisines_cost(df, n_customers=3, n_cuisines=9):
    # Group customer_id and count the number of orders for each customer
    customer_order_counts = df['customer_id'].value_counts()

    # Get top n_customers customers based on number of orders
    top_customers = customer_order_counts.head(n_customers).index

    # Filter DataFrame to include only orders from top customers
    top_customers_orders = df[df['customer_id'].isin(top_customers)]

    # Calculate the total cost of orders for each cuisine type
    cuisine_total_cost = top_customers_orders.groupby('cuisine_type')['cost_of_the_order'].sum()

    # Get top n_cuisines cuisines based on total order cost
    top_cuisines = cuisine_total_cost.sort_values(ascending=False).head(n_cuisines)

    return top_cuisines

# Get total cost for top 3 cuisines ordered by top  customers
top_cuisines_cost = top_customers_top_cuisines_cost(df, 3, 9)

print(top_cuisines_cost)
cuisine_type
American          232.64
Japanese           96.58
Indian             54.66
Middle Eastern     40.89
Chinese            31.53
French             24.20
Mexican            16.06
Spanish            14.50
Korean             12.23
Name: cost_of_the_order, dtype: float64
plt.figure(figsize=(10, 7))
plt.pie(top_cuisines_cost, labels=top_cuisines_cost.index, autopct='%1.1f%%', startangle=140, )
plt.title('Total Cost Distribution by Cuisine')
plt.axis('equal')  # Equal aspect ratio ensures that pie is drawn as a circle.
plt.show()

What are the ratings based on cuisine type and average rating from top customers only?
def top_customers_cuisine_rating_stats(df, n_customers=3):
    # customer_id and count number of orders for each customer
    customer_order_counts = df['customer_id'].value_counts()

    #  top n_customers customers based on number of orders
    top_n_customers = customer_order_counts.head(n_customers).index

    #  DF to include only orders from top n_customers customers
    top_customers_orders = df[df['customer_id'].isin(top_n_customers)]

    # empty lists to store ratings and number of ratings per cuisine
    cuisine_ratings = []
    cuisine_num_ratings = []

    # Iterate over each cuisine type
    for cuisine in top_customers_orders['cuisine_type'].unique():
        # orders for the current cuisine
        cuisine_orders = top_customers_orders[top_customers_orders['cuisine_type'] == cuisine]

        # 'Not given' ratings to NaN
        cuisine_orders['rating'] = pd.to_numeric(cuisine_orders['rating'], errors='coerce')

        # number of ratings and average rating for the current cuisine
        num_ratings = cuisine_orders['rating'].count()
        avg_rating = cuisine_orders['rating'].mean()

        # results to lists
        cuisine_ratings.append(avg_rating)
        cuisine_num_ratings.append(num_ratings)

    # DF to store results
    results_df = pd.DataFrame({
        'cuisine_type': top_customers_orders['cuisine_type'].unique(),
        'num_ratings': cuisine_num_ratings,
        'avg_rating': cuisine_ratings
    })

    return results_df

# Get ratings statistics for top customers for each cuisine
ratings_stats_per_cuisine = top_customers_cuisine_rating_stats(df, 3)

print(ratings_stats_per_cuisine)
     cuisine_type  num_ratings  avg_rating
0        American           11    4.090909
1         Chinese            1    3.000000
2  Middle Eastern            2    3.500000
3        Japanese            3    5.000000
4         Mexican            0         NaN
5          Korean            0         NaN
6          Indian            1    5.000000
7         Spanish            0         NaN
8          French            0         NaN
C:\Users\Brene\AppData\Local\Temp\ipykernel_16032\3916300919.py:21: SettingWithCopyWarning:
A value is trying to be set on a copy of a slice from a DataFrame.
Try using .loc[row_indexer,col_indexer] = value instead

See the caveats in the documentation: https://pandas.pydata.org/pandas-docs/stable/user_guide/indexing.html#returning-a-view-versus-a-copy
  cuisine_orders['rating'] = pd.to_numeric(cuisine_orders['rating'], errors='coerce')
Preparation time based on cuisine type
def top_customers_cuisine_preparation_time(df, n_customers=3):
    # customer_id and count the number of orders for each customer
    customer_order_counts = df['customer_id'].value_counts()

    # top n_customers customers based on number of orders
    top_n_customers = customer_order_counts.head(n_customers).index

    # DataFrame to include only orders from the top n_customers customers
    top_customers_orders = df[df['customer_id'].isin(top_n_customers)]

    # Total preparation time for each cuisine type
    cuisine_total_preparation_time = top_customers_orders.groupby('cuisine_type')['food_preparation_time'].sum()

    return cuisine_total_preparation_time

# total preparation time for each cuisine type for the top 3 customers
total_preparation_time_per_cuisine = top_customers_cuisine_preparation_time(df, 3)

print(total_preparation_time_per_cuisine)
cuisine_type
American          403
Chinese            67
French             28
Indian             46
Japanese          206
Korean             32
Mexican            35
Middle Eastern     51
Spanish            35
Name: food_preparation_time, dtype: int64
total_preparation_time_per_cuisine.sort_values( ascending=False, inplace=True)
plt.figure(figsize=(8, 6))
data=total_preparation_time_per_cuisine.plot(kind='bar', )
plt.title('Total Food Preparation Time by Cuisine (Top 3 Customers)')
plt.xlabel('Cuisine Type')
plt.ylabel('Total Preparation Time')
plt.xticks(rotation=45)
plt.show()

The company wants to provide a promotional offer in the advertisement of the restaurants. The condition to get the offer is that the restaurants must have a rating count of more than 50 and the average rating should be greater than 4. Find the restaurants fulfilling the criteria to get the promotional offer
def top_restaurants_by_ratings(df, min_rating_count=50, min_avg_rating=4):
    # Filter out "Not given" ratings to numeric values
    df_filtered = df[df['rating'] != 'Not given'].copy()
    df_filtered['rating'] = pd.to_numeric(df_filtered['rating'])

    #restaurant_name and calculate rating count and average rating
    rating_stats = df_filtered.groupby('restaurant_name')['rating'].agg(['count', 'mean']).reset_index()
    rating_stats.columns = ['restaurant_name', 'rating_count', 'avg_rating']

    # the conditions to be met
    top_restaurants = rating_stats[(rating_stats['rating_count'] >= min_rating_count) & (rating_stats['avg_rating'] >= min_avg_rating)]

    return top_restaurants

# top restaurants based on the criteria
top_restaurants = top_restaurants_by_ratings(df, min_rating_count=50, min_avg_rating=4)
print(top_restaurants)
               restaurant_name  rating_count  avg_rating
20   Blue Ribbon Fried Chicken            64    4.328125
21           Blue Ribbon Sushi            73    4.219178
136                Shake Shack           133    4.278195
153          The Meatball Shop            84    4.511905
top_restaurants.head()
| restaurant_name | rating_count | avg_rating | |
|---|---|---|---|
| 20 | Blue Ribbon Fried Chicken | 64 | 4.328125 |
| 21 | Blue Ribbon Sushi | 73 | 4.219178 |
| 136 | Shake Shack | 133 | 4.278195 |
| 153 | The Meatball Shop | 84 | 4.511905 |
The company charges the restaurant 25% on the orders having cost greater than 20 dollars and 15% on the orders having cost greater than 5 dollars. Find the net revenue generated by the company across all orders.
def top_restaurants_by_ratings(df, min_rating_count=50, min_avg_rating=4):
    #"Not given" ratings and convert ratings to numeric values
    df_filtered = df[df['rating'] != 'Not given'].copy()
    df_filtered['rating'] = pd.to_numeric(df_filtered['rating'])

    # restaurant_name and calculate rating count and average rating
    rating_stats = df_filtered.groupby('restaurant_name')['rating'].agg(['count', 'mean']).reset_index()
    rating_stats.columns = ['restaurant_name', 'rating_count', 'avg_rating']

    #  based on the conditions
    top_restaurants = rating_stats[(rating_stats['rating_count'] >= min_rating_count) & (rating_stats['avg_rating'] >= min_avg_rating)]

    return top_restaurants

# top restaurants based on the criteria
top_restaurants = top_restaurants_by_ratings(df, min_rating_count=50, min_avg_rating=4)
top_restaurant_orders = df[df['restaurant_name'].isin(top_restaurants['restaurant_name'])]
def calculate_advertising_charges(df):
    # Calculate the advertising charge based on the cost_of_the_order
    df['advertising_charge'] = df['cost_of_the_order'].apply(lambda x: 0.25 * x if x > 20 else (0.15 * x if x > 5 else 0))
    return df

#Advertising charges to the orders from top restaurants
top_restaurant_orders_with_charges = calculate_advertising_charges(top_restaurant_orders)

print(top_restaurant_orders_with_charges)
      order_id  customer_id            restaurant_name cuisine_type  \
3      1477334       106968  Blue Ribbon Fried Chicken     American
6      1477894       157711          The Meatball Shop      Italian
12     1476966       129969  Blue Ribbon Fried Chicken     American
15     1477414        66222                Shake Shack     American
19     1477354        67487          Blue Ribbon Sushi     Japanese
...        ...          ...                        ...          ...
1887   1476873       237616                Shake Shack     American
1888   1477353       106324          The Meatball Shop      Italian
1891   1476981       138586                Shake Shack     American
1895   1477819        35309          Blue Ribbon Sushi     Japanese
1897   1478056       120353          Blue Ribbon Sushi     Japanese

      cost_of_the_order day_of_the_week  rating  food_preparation_time  \
3                 29.20         Weekend     3.0                     25
6                  6.07         Weekend     NaN                     28
12                24.30         Weekend     5.0                     23
15                16.20         Weekend     5.0                     33
19                16.20         Weekend     4.0                     35
...                 ...             ...     ...                    ...
1887               5.82         Weekend     NaN                     26
1888              16.20         Weekend     5.0                     21
1891               5.82         Weekend     NaN                     22
1895              25.22         Weekday     NaN                     31
1897              19.45         Weekend     NaN                     28

      delivery_time  advertising_charge
3                15              7.3000
6                21              0.9105
12               17              6.0750
15               25              2.4300
19               26              2.4300
...             ...                 ...
1887             30              0.8730
1888             26              2.4300
1891             28              0.8730
1895             24              6.3050
1897             24              2.9175

[566 rows x 10 columns]
C:\Users\Brene\AppData\Local\Temp\ipykernel_16032\2839648762.py:20: SettingWithCopyWarning:
A value is trying to be set on a copy of a slice from a DataFrame.
Try using .loc[row_indexer,col_indexer] = value instead

See the caveats in the documentation: https://pandas.pydata.org/pandas-docs/stable/user_guide/indexing.html#returning-a-view-versus-a-copy
  df['advertising_charge'] = df['cost_of_the_order'].apply(lambda x: 0.25 * x if x > 20 else (0.15 * x if x > 5 else 0))
top_restaurant_orders_with_charges.head()
| order_id | customer_id | restaurant_name | cuisine_type | cost_of_the_order | day_of_the_week | rating | food_preparation_time | delivery_time | advertising_charge | |
|---|---|---|---|---|---|---|---|---|---|---|
| 3 | 1477334 | 106968 | Blue Ribbon Fried Chicken | American | 29.20 | Weekend | 3.0 | 25 | 15 | 7.3000 |
| 6 | 1477894 | 157711 | The Meatball Shop | Italian | 6.07 | Weekend | NaN | 28 | 21 | 0.9105 |
| 12 | 1476966 | 129969 | Blue Ribbon Fried Chicken | American | 24.30 | Weekend | 5.0 | 23 | 17 | 6.0750 |
| 15 | 1477414 | 66222 | Shake Shack | American | 16.20 | Weekend | 5.0 | 33 | 25 | 2.4300 |
| 19 | 1477354 | 67487 | Blue Ribbon Sushi | Japanese | 16.20 | Weekend | 4.0 | 35 | 26 | 2.4300 |
#Revenue generated across all orders
top_restaurant_orders_with_charges['advertising_charge'].sum()
1824.0994999999998
Advert Charges stands at 1824 dollars
# Add a new column 'total_time' which is the sum of 'food_preparation_time' and 'delivery_time'
df['total_time'] = df['food_preparation_time'] + df['delivery_time']

def percentage_of_long_orders(df, threshold=60):
    # %tage of orders with 'total_time' >= threshold
    total_orders = len(df)
    long_orders = len(df[df['total_time'] >= threshold])
    percentage = (long_orders / total_orders) * 100
    return percentage

# %tage of orders that take 60 minutes or more
percentage_60_plus = percentage_of_long_orders(df, 60)
print(f"Percentage of orders that take 60 minutes or more: {percentage_60_plus:.2f}%")
Percentage of orders that take 60 minutes or more: 12.91%
The company wants to analyze the delivery time of the orders on weekdays and weekends. How does the mean delivery time vary during weekdays and weekends?
average_delivery = df.groupby('day_of_the_week')['delivery_time'].mean()
print(average_delivery)
day_of_the_week
Weekday    28.340037
Weekend    22.470022
Name: delivery_time, dtype: float64
What are your conclusions from the analysis? What recommendations would you like to share to help improve the business?
Based on the analysis, we can derive several conclusions and recommendations to help improve the business:
Conclusions
Order Distribution by Cuisine
The majority of orders come from American, Japanese, and Italian cuisines. Lesser popular cuisines include Vietnamese, Spanish, and Korean.
Average Order Cost
Higher average order costs are associated with cuisines liThai, Southern and Frenchean. Lower average order costs are seen in cuisines liVietnamese, Mediterranean, and Koreanern.
Order Frequency by Day of the Week
The distribution of orders varies across weekdays and weekendCe cuisines might have higher demand on specific days (e.g., weekends might see more orders foverall of cuisine).
Food Preparation and Delivery Times
Average food preparation and delivery times differ by cuisine. Some cuisines have longer preparation and delivery times which might affect customer satisfaction.
Order Time Distribution
A significant percentage of orders take more th5n 60 minutes, which could impact customer satisfaction.
Top Customers
Identifying top customers and their preferences helps in personalizing marketing efforts. The top customers contribute significantly to revenue and order freque ncy.
Top Restaurants
Restaurants with high average ratings and frequent orders can be promoted to maintain and enhance customer loyalty.
Advertising Charges
Implementing advertising charges based on order costs could provide an additional revenue stream.
Recommendations
Focus on Popular Cuisines
Invest in marketing and promotions for the most popular cuisines (American, Japanese, Italian) to leverage their high demand. Introduce special offers or discounts to boost orders for less popular cuisines.
Improve Preparation and Delivery Efficiency
Analyze the preparation and delivery processes for cuisines with longer times to identify bottlenecks. Implement measures to streamline operations and reduce total time to enhance customer satisfaction.
Dynamic Pricing and Discounts
Implement dynamic pricing strategies based on demand patterns observed on different days of the week. Offer discounts on slower days to balance the order distribution.
Enhance Customer Experience
Focus on reducing the percentage of orders taking more than 60 minutes by optimizing logistics and staff management. Regularly gather customer feedback to identify pain points and areas for improvement.
Personalized Marketing
Use insights from top customers to personalize marketing campaigns and offers. Encourage repeat orders from top customers through loyalty programs and exclusive deals.
Promote High-Rated Restaurants
Highlight and promote restaurants with high average ratings and frequent orders in different marketing materials. Collaborate with these restaurants for special events like workshops/seminars or promotions.